CAR
http://www.r-graph-gallery.com/99-scatterplot-matrix-car-package/
ggplot+plotmatrix
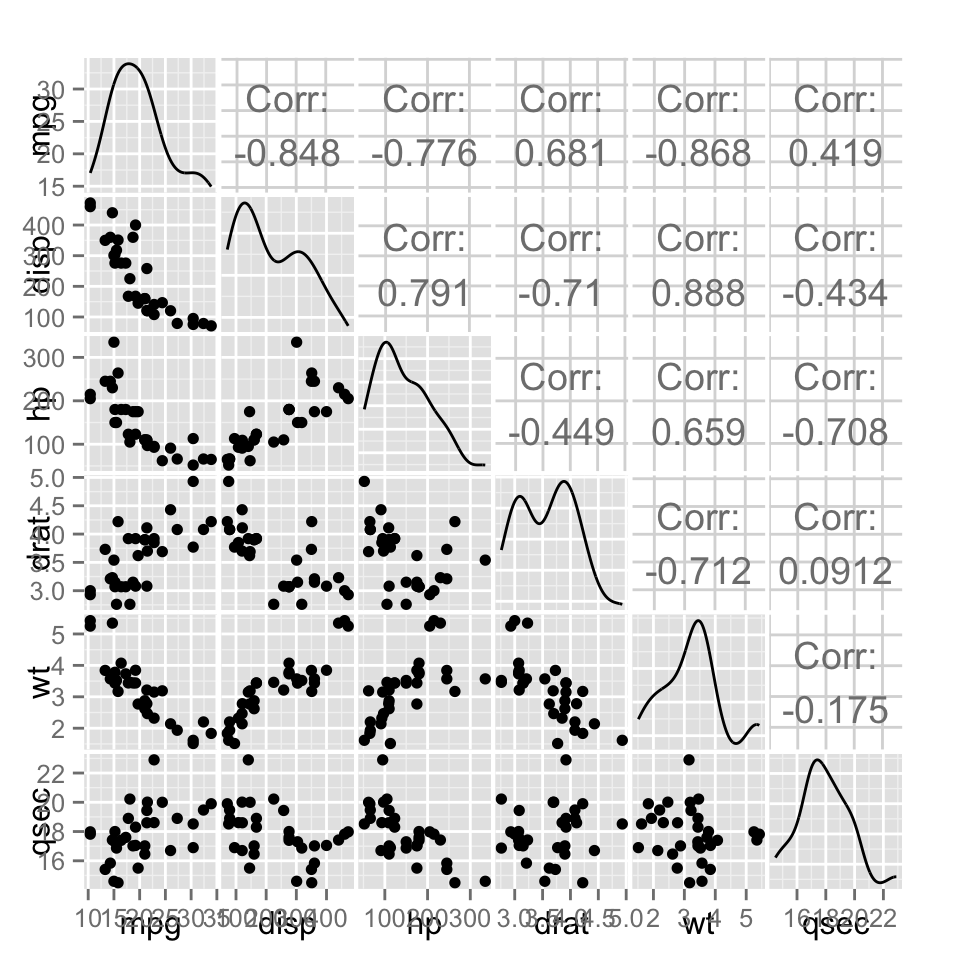
GGally
library(GGally)
ggpairs(iris[,1:4])


ggcorplot
ggcorplot(
  data = iris[1:4],
  var_text_size = 5,
  cor_text_limits = c(5,10))

Five ways to visualize your pairwise comparisons
https://www.r-bloggers.com/five-ways-to-visualize-your-pairwise-comparisons/
'R, Rstudio' 카테고리의 다른 글
| R에서 패키지 설치하기 (0) | 2020.05.06 |
|---|---|
| R graph gallery - data art (0) | 2017.09.24 |
| R에서 변수 리스트 보기 (0) | 2017.09.05 |
| R 에서 interactive 상자도표 box plot 그리기 - Plotly로 (0) | 2017.08.30 |
| R studio에서 stata 13용 데이터 불러와서 변수 설명 한글이 깨질 때 (4) | 2017.08.18 |
댓글