잔차의 정규분포 가정은 F-test와 T-test의 신뢰도를 보장하는 것이지 추정된 회귀계수와는 상관이 없다.
즉 오차항의 정규분포가 아니라도 unbiased 추정치를 산출한다.
* 주의 : 독립변수나 종속변수가 정규분포일 필요는 없다!! 잔차의 정규성이 중요하다.
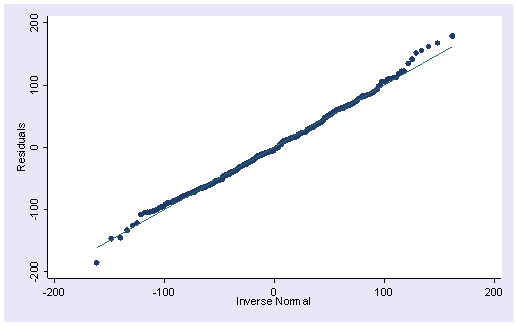
After we run a regression analysis, we can use the predict command to create residuals and then use commands such as kdensity, qnorm and pnorm to check the normality of the residuals.
가장 쉬운 방법은 predict로 잔차 변수를 만들어분포를 그려보는 것이다.(pdf ; kdensity)
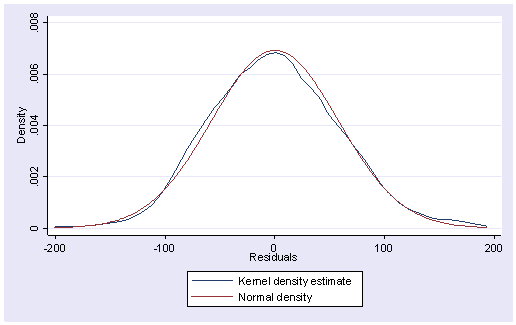
거의 완벽하게 정규분포를 띠고 있다.
pnorm is sensitive to non-normality in the middle range of data
qnorm is sensitive to non-normality near the tails.
pnorm rqnorm r
위배될 경우 다음 글 참조
http://psygement.github.io/ecor/part2/ch08/ch08.html
==========================================
이분산성 체크하기
회귀분석 후 아래 명령어.
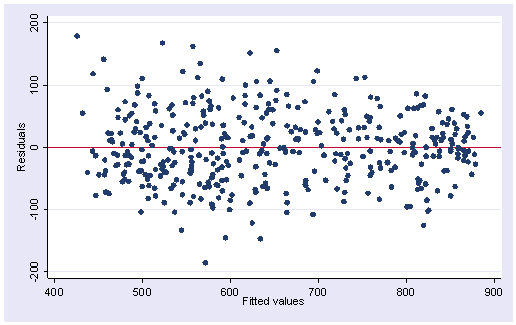
rvfplot, yline(0)
오른쪽으로 갈수록 잔차의 분산이 작아지는 것을 볼 수 있다. (이분산성이 있다.)
그러나 이정도면 심각하진 않다고 할 수 있다.
estat imtest   (화이트의 테스트)

Cameron & Trivedi's decomposition of IM-test

---------------------------------------------------
              Source |       chi2     df      p
---------------------+-----------------------------
  Heteroskedasticity |      18.35      9    0.0313
            Skewness |       7.78      3    0.0507
            Kurtosis |       0.27      1    0.6067
---------------------+-----------------------------
               Total |      26.40     13    0.0150
---------------------------------------------------
estat hettest
Breusch-Pagan / Cook-Weisberg test for heteroskedasticity
         Ho: Constant variance
         Variables: fitted values of api00
chi2(1) = 8.75 Prob > chi2 = 0.0031
=============================
다중공선성이 생길때의 문제는 계수값이 불안정해지고 표준오차가 과도하게 커질 수 있다는 점
The primary concern is that as the degree of multicollinearity increases, the regression model estimates of the coefficients become unstable and the standard errors for the coefficients can get wildly inflated.
방법
회귀분석 후 vif 실행
: variance inflation factor
vif

Variable |      VIF      1/VIF
---------+----------------------
   meals |      2.73    0.366965
     ell |      2.51    0.398325
    emer |      1.41    0.706805
---------+----------------------
Mean VIF |      2.22
As a rule of thumb, a variable whose VIF values are greater than 10 may merit further investigation.
10이 넘어가면 짚고 넘어가야.
vif

Variable |      VIF      1/VIF
---------+----------------------
  avg_ed |     43.57    0.022951
grad_sch |     14.86    0.067274
col_grad |     14.78    0.067664
some_col |      4.07    0.245993
  acs_k3 |      1.03    0.971867
---------+----------------------
Mean VIF |     15.66

10이 넘어가는 것들을 보자.
In this example, multicollinearity arises because we have put in too many variables that measure the same thing, parent education.
Let’s omit one of the parent education variables, avg_ed.
가장 높은 걸 하나 뺐다.
. vif
Variable | VIF 1/VIF
-------------+----------------------
col_grad | 1.28 0.782726
grad_sch | 1.26 0.792131
some_col | 1.03 0.966696
acs_k3 | 1.02 0.976666
-------------+----------------------
Mean VIF | 1.15
훌륭하다. 이제.
자 이제 표준오차가 어떻게 달라졌는지를 보자.
괄호 안의 값은 표준오차다. col_grad 나 some_col같은 경우를 보면 오차가 확실히 줄었다.
==============
Linearity
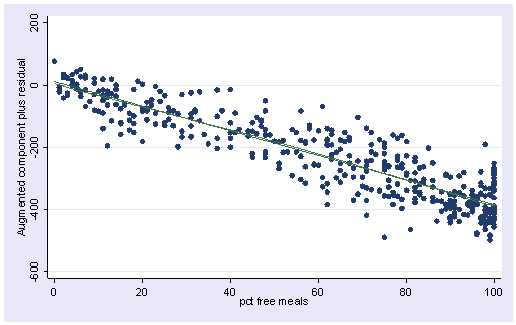
잔차를 각각의 독립변수에 대해 plot으로 그려본다.
특정한 패턴이 나타나면 linearity에 대해 의심해봐야 한다.
acprplot meals, lowess lsopts(bwidth(1))
이렇게 몰려있는 것은 skew가 크다. 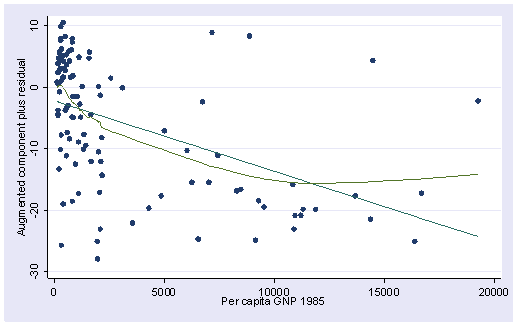
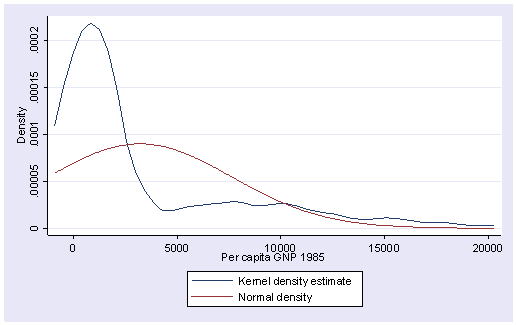
로그변환해주는 방법이 있다.
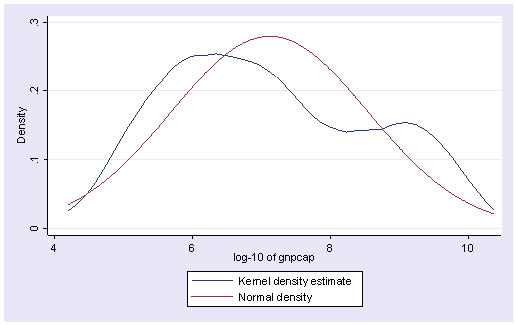
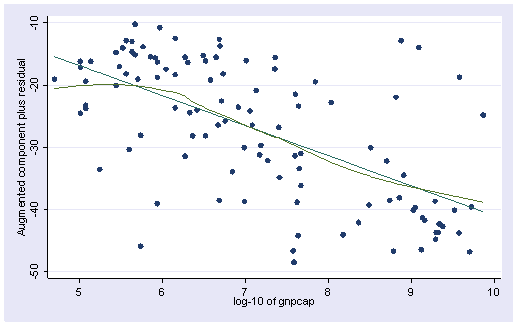
어느정도 선형성을 만족시키게 되었다. R제곱이 약간 늘어났다.
참고
http://www.columbia.edu/~so33/SusDev/Lecture_5.pdf
'통계 , 수학' 카테고리의 다른 글
| [통계, stata 학습 자료 / 사이트] (0) | 2017.08.09 |
|---|---|
| avplot (Partial Regression Plot) (0) | 2017.08.08 |
| 회귀분석 진단하기 (with STATA) - 아웃라이어의 진단과 처리 (0) | 2017.08.08 |
| 다중회귀분석의 가정들 (0) | 2017.08.07 |
| 통계에서의 효율성 (efficiency) (0) | 2017.08.06 |
댓글