Influence
fitted value에서 한참 벗어나는 outlier가 있다. 산점도를 그려봤을 때 혼자 멀리 떨어져 있는 애다.
또는 데이터 상에 혼자 지나치게 크거나 작은 값을 가지고 있는 관측치가 있다.
이러한 것들은 추정에 왜곡을 가져오게 된다.
Studentized residuals are a type of standardized residual that can be used to identify outliers.
회귀분석 후
predict r, rstudent


. stem r

Stem-and-leaf plot for r (Studentized residuals)

r rounded to nearest multiple of .01
plot in units of .01

 -3** | 57
 -3** |
 -2** |
 -2** |
 -1** | 84,69
 -1** | 30,15,13,04,02
 -0** | 87,85,65,58,56,55,54
 -0** | 47,46,45,38,36,30,28,21,08,02
  0** | 05,06,08,13,27,28,29,31,35,41,48,49
  0** | 56,64,70,80,82
  1** | 01,03,03,08,15,29
  1** | 59
  2** |
  2** | 62
  3** |
  3** | 77


2.58을 넘어가면 99%의 신뢰수준을 벗어나는 것이다.
hilo라는 패키지를 쓰면 편하게 알 수 있다.
(높고 낮은 10개의 변수를 보여줌)
predict lev, leverage

레버리지라는 옵션이 있다.

stem lev

Stem-and-leaf plot for l (Leverage)

l rounded to nearest multiple of .001
plot in units of .001

  0** | 20,24,24,28,29,29,31,31,32,32,34,35,37,38,39,43,45,45,46,47,49
  0** | 50,57,60,61,62,63,63,64,64,67,72,72,73,76,76,82,83,85,85,85,91,95
  1** | 00,02,36
  1** | 65,80,91
  2** |
  2** | 61
  3** |
  3** |
  4** |
  4** |
  5** | 36


Generally, a point with leverage greater than (2k+2)/n should be carefully examined. Here k is the number of predictors and n is the number of observations

lvr2plot,
옵션  dfits / cooksd

dfbeta
list state DFpctmetro DFpoverty DFsingle in 1/5

         state  DFpctme~o  DFpoverty   DFsingle
  1.        ak  -.1061846  -.1313398   .1451826
  2.        al   .0124287   .0552852  -.0275128
  3.        ar  -.0687483   .1753482  -.1052626
  4.        az  -.0947614  -.0308833    .001242
  5.        ca   .0126401   .0088009  -.0036361
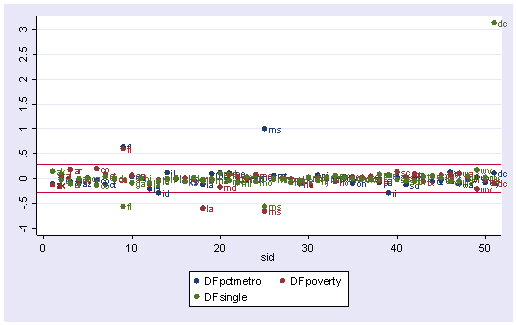
The value for DFsingle for Alaska is .14, which means that by being included in the analysis (as compared to being excluded), Alaska increases the coefficient for single by 0.14
해당 관측치가 없을때보다 있을때 해당 변수의 계수값이 어떻게 변할지를 나타내주는 것이다.
scatter DFpctmetro DFpoverty DFsingle sid, ylabel(-1(.5)3) yline(.28 -.28) ///
  mlabel(state state state)
| Measure | Value |
| leverage | >(2k+2)/n |
| abs(rstu) | > 2 |
| Cook’s D | > 4/n |
| abs(DFITS) | > 2*sqrt(k/n) |
| abs(DFBETA) | > 2/sqrt(n) |
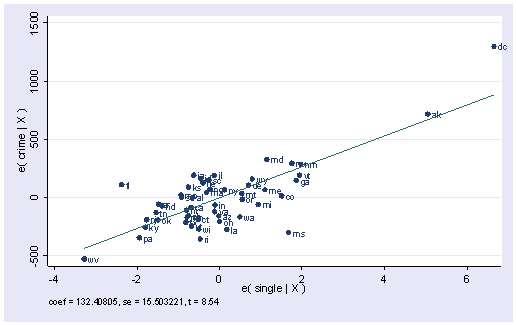
avplot single, mlabel(state)
'통계 , 수학' 카테고리의 다른 글
| avplot (Partial Regression Plot) (0) | 2017.08.08 |
|---|---|
| 회귀분석 진단하기 (with STATA) - 잔차의 정규분포성(normality of risiduals), 이분산성(heteroscadasticity of variance of risiduals), 다중공선성(multicolinearity in dependant variables), 선형성(linearity) (0) | 2017.08.08 |
| 다중회귀분석의 가정들 (0) | 2017.08.07 |
| 통계에서의 효율성 (efficiency) (0) | 2017.08.06 |
| Gini's mean differance (GMD)와 지니계수 (0) | 2017.08.04 |


댓글